
This article is being co-posted on NHLNumbers as well as on my own site, OriginalSixAnalytics.com. Find me @michael_zsolt on twitter. If you are able, please provide some support to public data providers Corey Sznajder (@ShutDownLine), Corsica and Puckalytics
Every team in the NHL is constantly striving to find market inefficiencies to capitalize on towards the goal of creating value and ultimately winning games. Whether done by finding undervalued assets or developing a set of sustained competitive advantages – every team should always have these concepts in mind.
The analytics community has widely acknowledged we are not as good at evaluating defensemen as we are at evaluating forwards – in part due to having fewer effective metrics available. As a result, a number of people have spent time trying to expand our knowledge in this area – as any new development would be sure to present a strong market opportunity to capitalize on.
A particular focus has been on applying Eric Tulsky’s historical zone entry and exit analysis to defensive evaluation. Given controlled entries into the offensive zone (carry-ins) have been proven to generate more shots than uncontrolled entries (dump-ins) – intuitively, if a defender can prevent controlled zone entries against his team, that should reduce shot attempts against.
There has been a lot of great work done on this subject, including articles by the likes of Sean Tierney, Dom Luszczyszyn, JenLC and more. Dim Filipovic at Sportnet has written a number of times on the value of tracking the percentage of entries against that are controlled, as well as the number of controlled zone exits that a defender creates. This type of work has broken ground recently in evaluating defensemen. However, in an article late last season Dimitri summarizes the current gaps in the analysis as well:
“It’s important to retain perspective on all of these figures. At this point they’re much more descriptive than predictive, in the sense they’re telling us how a certain player did in the games he’s already played, but not necessarily helping us forecast how he’ll do in the future. There’s also the fact that most players only have [only] ~10 games worth of data to their name, which leaves plenty of room for inexplicable swings in either direction.”
So far, the best evidence to support the repeatability of these metrics is on the zone entries against side – where Eric Tulsky used a full season of tracked data for the Philadelphia Flyers’ defensemen to test this. His results are here. While this analysis definitely hints at a relationship, I suspect Eric himself would say a sample of only six defensemen should be seen only as a ‘first step’ that can built upon in the future.
As such, my goal in this article is to test, replicate and expand Tulsky’s work, as well as to hopefully broaden it to some uncharted territory. I also hope to encourage others to recognize the amazing data being made available by Corey Sznajder’s tracking efforts – which you can access here and here. Hopefully others will decide to support Corey by purchasing his data, and do further work to expand our knowledge in these areas as well.
Definitions
Let’s start with some important definitions:
- Zone Entry Attempt Against (ZEA) – Any time an opponent is attempting to bring the puck into your defensive zone; it is registered against the player (e.g. defenseman) who is most closely defending the play across the blue-line
- Controlled ZEA – When the opponent gains access to your defensive zone by successfully carrying-in or passing-in the puck, retaining possession
- ‘Break up’, or ‘Failed Entry Against’ – When the defender is able to prevent the entry from gaining access to the zone, turning over possession
- Zone Exit Attempt – Any time a skater is attempting to move the puck across his own blue line, whether carried, passed or dumped/cleared out
- Zone Exit with Control – Any time a skater successfully carries the puck out or passes it out of his own zone, retaining possession
A simple way to think about preventing controlled ZEA’s is that it is the act of ‘Protecting the Blue-line’. Likewise, individual controlled zone exits represent players who are strong puck-movers, or who excel at ‘Driving Break-outs’.
Key Questions
With respect to preventing controlled ZEA, being able to break-up plays, and driving controlled zone exits (whether as a % of total, or per 60 minutes of play), my key questions are as follows:
- Predictive – Are these repeatable skills? Is past performance a reliable indicator of future performance?
- Relationship with Goals – Do these metrics drive improvement in Goals For Differential (GF%), by either increasing goals for or decreasing goals against?
- If not, do these metrics at least help to drive the other inputs that translate into GF%? (I.e. xGF%, Shots, Corsi-For%, etc.)
“Protecting the Blue Line” – Zone Entry Defense
Let’s start with protecting the blue line: preventing controlled entries against, or breaking up entry attempts. To be clear, a lower percentage is better – the lower the proportion of controlled entries against a defenseman, the fewer goals and shots against you would expect. (In the interest of time, I have focused more so on ZEA, rather than break up %.)
Repeatability
To test repeatability I have done a ‘split-half’ test to see how well the 1st half of a season of data predicts the second half. All data is from Corey’s 2013-2014 tracking – the only full season of publicly-available tracked entry data. I have only included defensemen with over 150 entries-against in each half, for a total sample of N=148. (Note – the mid-season mark wasn’t technically the 41st game as Corey only captured zone entry defense for the final 60-65 games).
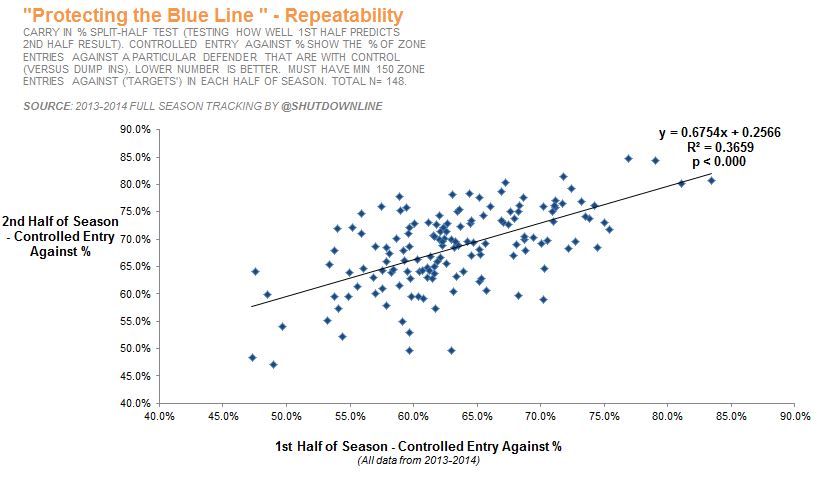 As you can see above, mitigating controlled entries against % is a highly repeatable skill with a relationship (R^2) of 0.37 between first half and second half results. I think this is a very exciting finding, as it shows the recent work of Dimitri, Sean and others is spot on – and that past performance should be predictive of future performance.
Relationship with goals
The next question is ‘does this improve GF%’? Intuitively I think we all expect it would, but it is still important to check. To evaluate this I tested the relationship (R^2) between controlled entry against (% and per-60) and a wide range of metrics: goal differential, goal and shot against rates, and ‘rel’ stats – i.e. stats that adjust goal and shot rates to be more focused on individual, rather than team-level, play.
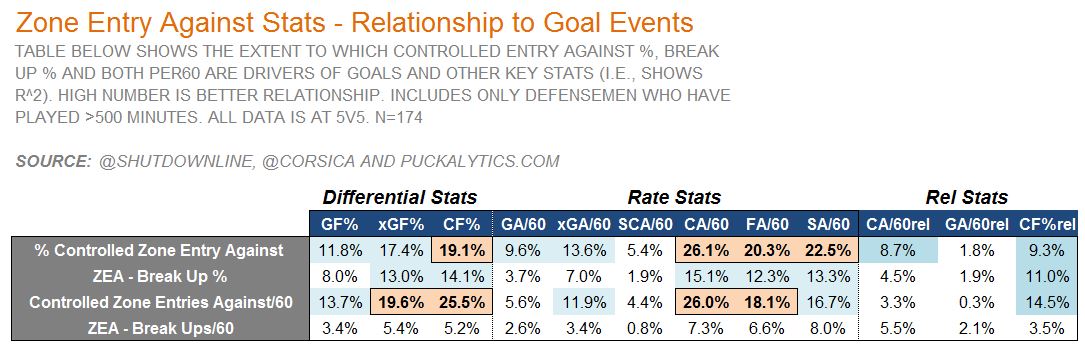
As you can see above, there are some interesting results. First, many on-ice stats are significantly impacted by these metrics. In particular, ZEA with control (% and per 60) show a meaningful relationship with xGF%, CF% and CA/60, which are all at an R^2 around or above 20%.
However, it is interesting to note that when you focus on individual impact (i.e. rel stats), the relationship is considerably weaker than with unadjusted on-ice stats, which are more influenced by teammates. As such, while preventing controlled ZEA is repeatable, and does meaningfully impact goals and shot rates – there may also be team/system impacts that are difficult to separate out from the individual contribution.
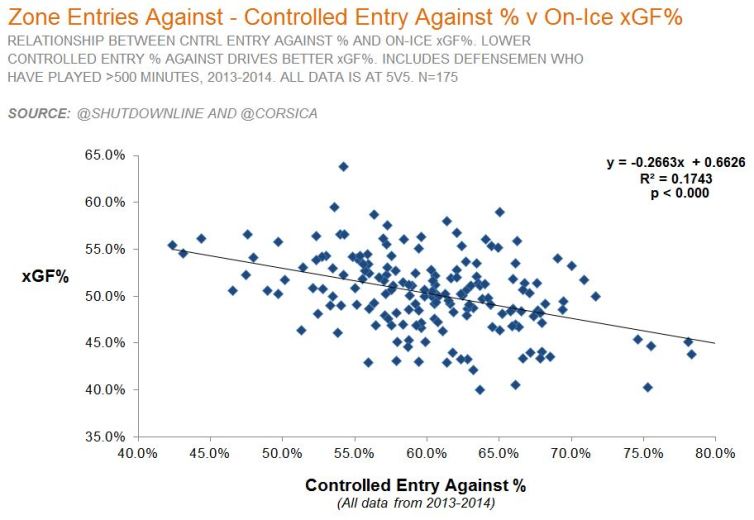
Last, let’s ‘zoom in’ one on of the cells above: % Controlled Entry Against vs xGF%. the chart below illustrates the direct relationship between reducing controlled entries against and improving expected goals.
“Driving Break-outs” – Zone Exits with Control
Now, let’s look at the zone exit side, or ‘Driving Break-outs’. Comparing the Exit data to ZEA, there are a couple nuances to mention: first, the data is slightly more limited in this area. Corey provides raw tracked data in 2013-2014 for all offensive zone entries and for all ZEA – which allowed me to separate it into split-half components. Unfortunately, I checked with Corey, and for the 2013-2014 zone exits the tracking was done offline and aggregated at the end. As such, there is no full season of raw data that we can use to do a repeatability test.
On the positive side, Corey has been providing the raw data for his new 2016-2017 tracking work which is well underway (maybe 10-15+ games tracked per team thus far). As such, by the end of the season, we should have another full year of data – and I will at that point confirm whether or not Controlled Zone Exits are a repeatable skill. My guess is that this will ultimately be shown to be the case, as simply from watching, certain defensemen seem to be natural puck-movers (Karlsson, Josi), and others seem to be less so (Polak).
Last, the 2013-2014 zone exit data lacked some key elements (which Corey has done well to include in the 2016-2017 work). The old data did not have a broad ‘failed’ zone exit category, nor did it show what Corey now calls ‘Transitional Plays’ – i.e. getting the puck out of the zone while surrendering possession via a clearing attempt. As such, we can’t say the proportion of the time an individual’s exit attempts were successful. However, we are still left with some very valuable data – individual Zone Exits/60 and Controlled Exits /60 – as defined above.
Relationship with goals
So – if we assume for now that Controlled Exits are a repeatable skill (and not simply randomness) – do they have a strong relationship with goal events?
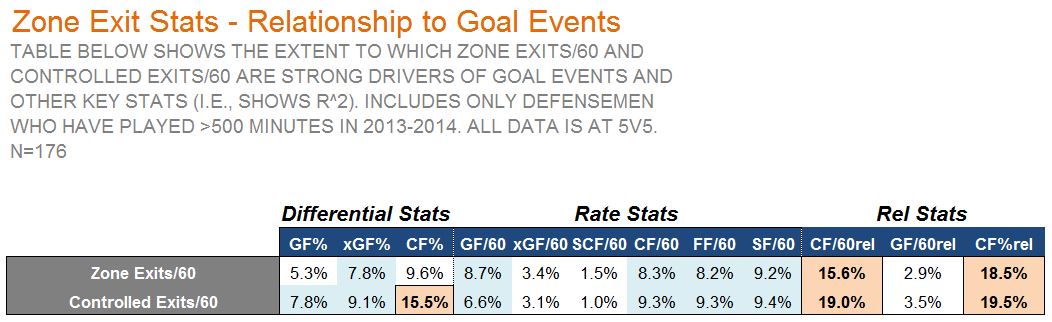
The chart above shows some very interesting findings. First, zone exits with control have a fairly meek impact on GF% and xGF% directly. This isn’t entirely surprising, as exiting your own zone with control can only get you so far towards scoring. However, there is a more relevant relationship between Controlled Exits/60 and CF% – with an R^2 of 15.5%. This shows that having a defender who is strong puck mover can definitely begin to ‘move the needle’ on winning the shot-differential battle.
Lastly, what I found most intriguing here were the Rel Stats – where the metric is adjusted for how a player’s team does with him on the ice versus off the ice (i.e. isolating individual contribution). While teammates can play a bigger role in helping a defensemen prevent controlled ZEA, Zone Exits are actually the opposite – both CF/60rel and CF%rel have a ~19% relationship (R^2) with Controlled Exits/60, stronger than CF% alone. This demonstrates that strong individual play from puck-moving defensemen can have a major CF% impact strictly from their ability to exit the zone with control.
Before wrapping up, let’s ‘zoom in’ again on the relationship between Controlled Exits/60 and CF%rel.
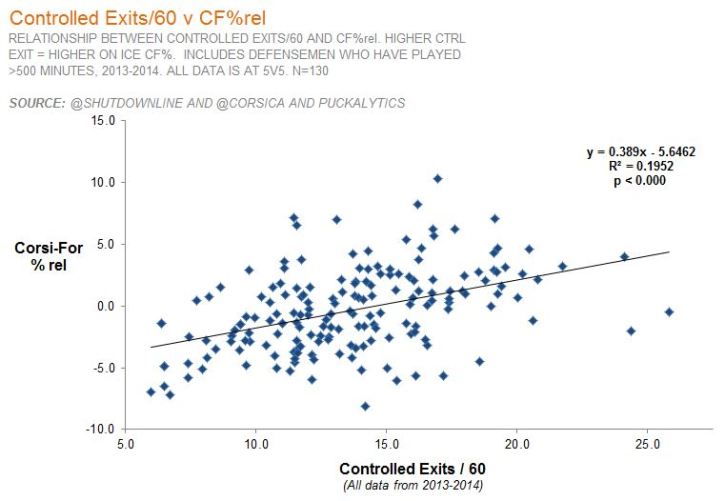
The chart above shows how a Defensemen’s individual controlled exits/60 have a meaningful impact on his ability to be a net-contributor to his team’s Corsi-For %.
Tying it all together – what these two sets of analysis tell us is that a great puck-moving defender can have a substantial impact on his team’s shot-attempts, as well as overall shot attempt differential, through his ability to Drive Break Outs. Further, a defenseman who excels at Protecting the Blue-line will have the greatest impact when surrounded by teammates and playing within a system that does so as well. Naturally, the greatest value will be found in acquiring players who show both these skills , even if they don’t necessarily contribute significantly in terms of goals and points.
Conclusion & Practical Applications for Teams
As should now be clear, these types of new metrics for defensive evaluation are very interesting and important. They appear to be repeatable skills (at least for ZEA), and they do have a material impact on a team’s xGF% or at the very least, its CF%. While they are visible to anyone watching a defenseman closely – just like batting average or save % – only over dozens of games of tracking can we truly quantify and understand how well a player performs on each.
So – practically speaking – what should NHL or teams at other levels do about this? Gather the data! At a minimum, every team in the league should be tracking their own player’s performance on these metrics in order to better game plan, develop, and observe improvements or deficiencies over time. Further if any team ever took a systematic effort to track these on a league-wide basis (like – say – the Florida Panthers…), it would almost certainly present a clear competitive informational advantage that can help them build value over the long term.
Such a team could have a greater understanding of the value of their own players, and also directly identify defenders around the league that may have a big impact on their team’s results, despite low goal or point totals. At this point, teams should be compelled to begin acting on this knowledge to build an ‘edge’. If not, eventually they may be doing so just to prevent themselves from falling too far behind.

This was interesting to read, thank you. My question would be, considering the DF quote you included here re: the descriptive/predictive distinction, how your analysis of 65 games from the 2013-14 season can actually be a reliable sample to assess predictability? I’m ignorant as far as statistical models. I don’t know what a split-half whatever is. Comparing the first 30 games to the lady 30 games for defenseman with 150+ DZEA in each half…wouldn’t we need multiple seasons worth of data to really gauge repeatability? After all, plenty of stats are prone to somewhat stark jumps or falls year-to-year, right? I’m not criticizing, I’m not smart enough to… I’m asking. Thanks again.
LikeLike