
Dimitri Filipovic recently wrote a great article summarizing that – despite the NHL’s rhetoric of ‘parity’ – it is a still a league where the teams’ with the greatest financial resources tend to be the most successful. After reading his piece, I wanted to write a short article building on this concept, where I will show that although having more resources is an advantage, how efficiently a team manages its salary cap space is just as important as how much they spend.
In this piece I will apply the same methodology I have used previously, where I showed how the Goals Above Replacement (GAR) metric can be used to quantify both a player’s and their team’s salary cap efficiency. I will apply the same methodology in order to do a league-wide review of salary cap efficiency in 2014-2015. Doing so, I will argue that (i) salary cap efficiency is an integral lens for all teams to look through when building their roster, and (ii) although an efficient use of salary cap alone will not win a team the Stanley cup – ignoring this type of financial analysis can quickly push them out of Cup or playoff contention entirely.
Determining Team-level Salary Cap Efficiency
Salary Cap Efficiency is defined as how effectively a team uses its salary cap space, based on a bottom-up analysis of each individual player. To calculate it, I first derive the fair market value of all players as a function of their GAR (FMV = $575K + ($467K * GAR)). Then, I compare that to the Average Annual Value (AAV) of each player’s contract – his cap hit – in order to see if he is being over or under-paid. By aggregating this analysis for an entire team, you can see (a) which player contracts on each team are the most cost-efficient, and (b) approximately how well that team manages its salary cap as a whole.
As a quick refresher, here are two previous charts that summarize the cap efficiency of the 2014-2015 Chicago Blackhawks. The first chart shows all members of the team in relation to the Fair Market Value equation that I just described. The second shows the amount of value created or lost on each individual’s contract.
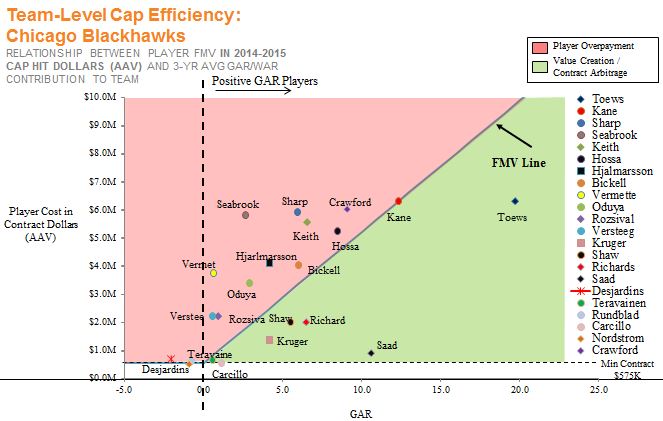
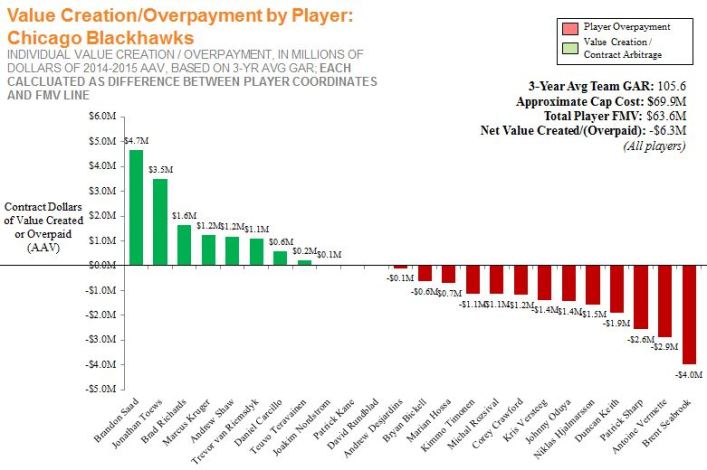
You can see from this that – as the Stanley Cup winning team – most of Chicago’s players are quite close to the FMV line, with only a few exceptions (Seabrook, Toews, Saad). Also, to be clear, we should never expect a team to price/negotiate any given player’s contract ‘perfectly’ – there will always be far too many changing variables in that player’s performance in the years after signing. However, a team can be most competitive by largely signing players with positive GAR, and by generally paying them within a reasonable range of their FMV – or much less, as enabled by their ELC/RFA deals.
In the second chart, I also want to draw your attention to the ‘Net Value Created/(Overpaid)’ figure shown under the legend, of -$6.3M. This figure is the sum of all individual player amounts displayed on the chart. Keep it in mind, as it provides the core of my analysis in the next section.
(Side note: this Net Value Created figure for the Blackhawks specifically will not tie perfectly to my analysis in the next section. The next section is based on team 2014-2015 GAR scores, where the chart above is based on 3-year average GAR).
Application Across the League
Now, I will apply this type of analysis across the league in order to show which teams had the most cap-efficient roster in 2014-2015, and how that may have impacted their results in the standings. Given this is a GAR-based analysis I will start by showing the total Goals Above Replacement of all teams in the league.
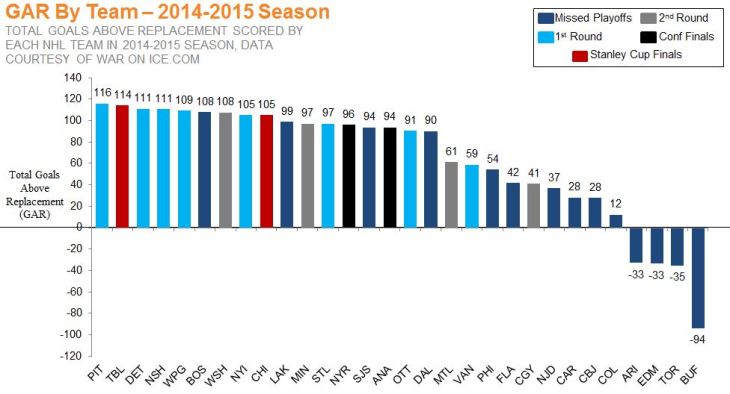
Looking at this, a few things are worth pointing out:
- The vast majority of playoff teams are concentrated on the left hand side of this graph, and likewise the non-playoff teams are on the right
- There are obviously exceptions where teams likely should have made the playoffs, but didn’t (e.g. BOS, LAK), or teams that did make the playoffs and maybe shouldn’t have (CGY, VAN)
- Although this is a sample of only one season, I think it supports the validity of GAR as having a strong connection with a team’s success – despite only being available retroactively
In order to keep this brief I will fast forward a few steps (e.g. I will not show the calculations for getting the FMV of each team’s roster, and subtracting their total salary cap hit from that). Instead, here is the result, which is the Net Value Created/Overpaid for each team over the season, in absolute dollars.
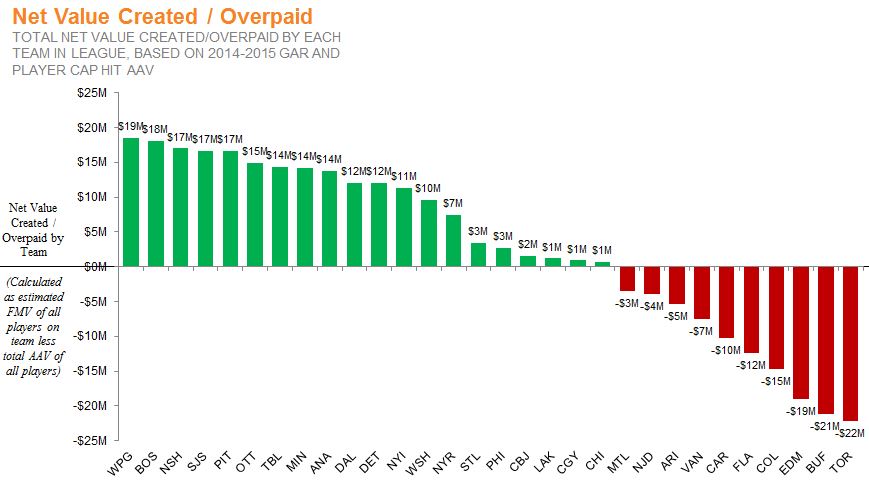
Although this is a useful way to look at how well a team spent, it is also impacted by their total salary cap dollars. Given Dimitri’s point about the varying spending power across teams, it is important to look at this on a basis that is directly comparable across teams. As such, I have calculated each team’s ‘Salary Cap Efficiency %’ by simply dividing their Net Value Created by their total cap hit. The larger the percentage, the more efficiently a team has managed its cap.
The chart below shows the relationship between where a team finished in the playoff race along with its Cap Efficiency %. To be clear – a higher percentage (top of the chart) is a more efficient use of cap space, and a lower percentage is a worse use of cap space.
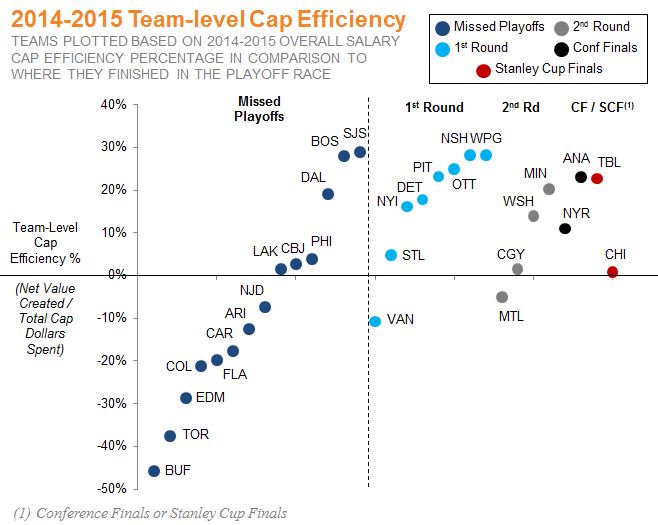
Here are some observations from this chart:
- Most playoff teams are above 0% on cap efficiency – e.g. successful playoff teams are not wasting money by overpaying for players
- Notably, Chicago was barely above 0%, having won the cup, and both Nashville and Winnipeg were in the ~30% range, while both being eliminated in the first round – showing that maximizing salary cap efficiency clearly won’t win you the Stanley cup on it is own
As Filipovic’s article made clear, greater financial resources will always help a team get the best talent, despite their efficiency or inefficiency. This chart does not highlight which teams spent the most overall, and naturally if two teams are getting the same ‘bang for their buck’ (spending at equal efficiency), the team that spends more will of course win out.
Despite this, a team can very easily ruin its own chance of being a contender by failing to look at its roster through a properly quantified salary cap efficiency lens. Below is another version of the same chart, where I have highlighted the large and unfortunate set of teams whose inefficient use of cap space has very likely impacted their ability to be a contender.

Fortunately for the teams in the bottom left quadrant, I think they are all well aware of their situations, and doing everything in their power to undo the current mess they find themselves in (with maybe one exception).
Conclusion
To wrap up, I think it should be clear that any team not conducting salary cap efficiency (or similar) analysis when contemplating its long-term roster construction is taking a significant risk. Being the most cap-efficient team may not be able to win you a Stanley Cup on its own (which Boston and San Jose learned the hard way in 2014-2015) – but having a very poorly managed cap is uniquely capable of taking your team out of contention. All that being said, we of course should keep in mind that cap efficiency is only one piece of the puzzle – to use dollars efficiently a team first has to acquire players worth spending money on.

Hi,
As a Habs Fan, I can’t help but notice that Montreal is at the wrong end of your compilation as a perfoming team with poor cap efficiency. Is it possible to have access to your in-detailed sheet for each player such as you did for the Blackhawks? In fact, I would be extremely interested to have a look at the 30 teams but I realize the audacity of such a demand.
Regards,
LikeLike
Marc-Andre,
Thanks for your comment. Two things:
1. I wouldn’t say they are on the ‘wrong end’ of the compilation – by being slightly below 0%, they are not meaningfully worse than Chicago, for example. I would actually describe the major finding here to be that, as long as a team isn’t meaningfully lower than zero, then they have kept themselves in contention. How far above zero does not appear to meaningfully determine playoff success.
2. In terms of additional data – if you want to find the individual player information, I can direct you a bit further. Player-by-player GAR data is available (for individual seasons) here https://originalsixanalytics.com/osas-war-explainer-index/ – simply click the ‘Pre-series’ link. That is in excel and hopefully easy to read. If you filter that by 2014-2015 and MTL, you can see the players included, and their GAR score for the season shown (team is heavily dominated by Carey Price, as you might expect). Besides that, the only math on an individual player basis is to calculate FMV (at the equation shown above, in the article), and compare that to each players cap hit, which you can find at http://www.generalfanager.com, or ‘Spotrac.com’
Hope that helps!
-Andrew
LikeLike
Hi Andrew,
It does help! Thanks a lot. I’ll definitely spend a lot of time on this!
As for 1), you are right. But considering Montreal management had their eye on the Cup, my comparison was not based on a pure positive/negative value, but rather compared to other Stanley Cup contenders. Given that we were only better than CGY and VAN, which were considered as flukes team (by the analytics community at least), I’d say that’s…bad.
LikeLike
Any idea when the 2015-2016 stats will be available?
LikeLike
Someone asked this as well on twitter. I apologize if I didn’t make it clear in the article (and in hindsight, I don’t think I did – I tended to mention it a lot more in my earlier posts) – all of the GAR data is courtesy of the website WAR-On-Ice.com. It is a great site that did some amazing work. The downside though, is that its founders got hired by teams, and so there is no one left to run the website. It is still up as of today, but it is actually imminently about to come down (e.g. end of 2015-2016 season). I have asked and probably bugged them a bit in terms of this exact question you ask, and it seems unlikely that the 2015-2016 data will ever be released. However, I think the Corsica.hockey website is thinking of creating a ‘GAR’ stat of its own – which ideally could be a very good replacement, if it does get created.
Cheers
LikeLike